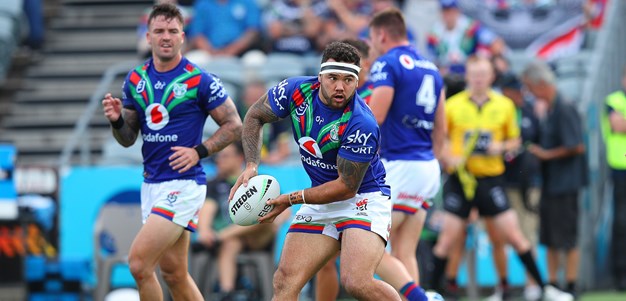

Jazz Tevaga
Lock
Player Bio
- Height:
- 178 cm
- Date of Birth:
- 04 September 1995
- Weight:
- 98 kg
- Birthplace:
- Christchurch, NZ
- Age:
- 28
- Nickname:
- -
- Debut Club:
- New Zealand Warriors
- Date:
- 20 March 2016
- Opposition:
- Melbourne Storm
- Round:
- 3
- Previous Club:
- Nil
- Junior Clubs:
- Burnham Chevaliers, Papakura Sea Eagles
- Biography:
After just 15 NRL appearances in his first two seasons, Jazz has become a key component in the team's mix, bringing heart, energy and desire every time he 's on the field.
Across the 2018 and 2019 campaigns he appeared in 42 of the club's 49 games, mainly injected off the bench to lift the side but also being used towards the end of the 2019 season as a starting loose forward.
His progress in 2020 was stymied following offseason surgery and further injuries which kept him out of the first eight rounds of the Covid-affected season.
When he was finally cleared to make his return against Gold Coast in round nine, Tevaga made an immediate impact coming off the bench. By the 11th round he was back as the starting loose forward.
While he's one of the smaller forwards around at just 178cm and 98kg, he's also one of the NRL's toughest forwards.
Jazz played in all four of Toa Samoa’s matches at the 2017 Rugby League World Cup.
Career
- Appearances
- 123
- Tries
- 9
2024 Season
- Appearances
- 4
Scoring
- Tries
- 1
Attack
- Tackle Breaks
- 5
- Average Hit Ups
- 7.8
- Post Contact Metres
- 116.6
Passing
- Offloads
- 0
Defence
- Tackles Made
- 59
- Tackle Efficiency
-
Running Metres
- Average Running Metres
- 74
- Total Running Metres
- 296
Fantasy
- Total Points
- 103
- Average Points
- 25.8
2024 Season - By Round
| Round | Opponent | Score | Position | Minutes Played | Tries | Goals | 1 Point Field Goals | 2 Point Field Goals | Points | Try Assists | Linebreaks | Tackle Breaks | Post Contact Metres | Offloads | Receipts | Tackles Made | Missed Tackles | Total Running Metres | Hit Up Running Metres | Kick Return Metres | |
|---|---|---|---|---|---|---|---|---|---|---|---|---|---|---|---|---|---|---|---|---|---|
| 2 | Storm | Lost | 30 - 26 | Replacement | - | - | - | - | - | - | - | - | - | - | - | - | - | - | - | - | - |
| 3 | Raiders | Won | 18 - 10 | Interchange | 34 | - | - | - | - | - | - | - | 2 | 50 | - | 12 | 27 | 1 | 101 | 89 | - |
| 4 | Knights | Won | 20 - 12 | Interchange | 23 | - | - | - | - | - | - | - | - | 18 | - | 5 | 13 | 1 | 38 | 38 | - |
| 5 | Rabbitohs | Won | 4 - 34 | Interchange | 32 | - | - | - | - | - | - | - | - | 37 | - | 14 | 15 | 2 | 113 | 113 | - |
| 6 | Sea Eagles | Drawn | 22 - 22 | Interchange | 9 | 1 | - | - | - | 4 | - | 1 | 3 | 12 | - | 7 | 4 | - | 43 | 31 | 11 |
Career By Season
| Year | Played | Won | Lost | Drawn | Win % | Tries | Goals | 1 Point Field Goals | 2 Point Field Goals | Points | Kicking Metres | Kicking Metres Average | Forced Drop Outs | Tackle Breaks | Post Contact Metres | Offloads | Tackles Made | Missed Tackles | Tackle Efficiency | Total Running Metres | Average Running Metres | Kick Return Metres | Total Points | Average Points | |
|---|---|---|---|---|---|---|---|---|---|---|---|---|---|---|---|---|---|---|---|---|---|---|---|---|---|
| Warriors | 2016 | 11 | 5 | 6 | - | 45% | 1 | - | - | - | 4 | - | - | - | 14 | 153 | 4 | 258 | 13 | 92.95% | 523 | 47.00 | - | 320 | 29.1 |
| Warriors | 2017 | 4 | - | 4 | - | - | - | - | - | - | - | - | - | - | 3 | 77 | 4 | 112 | 12 | 90.32% | 268 | 67.00 | 23 | 118 | 29.5 |
| Warriors | 2018 | 20 | 10 | 10 | - | 50% | 1 | - | - | - | 4 | 15 | 0.74 | - | 37 | 604 | 33 | 731 | 50 | 93.60% | 1,702 | 85.00 | - | 926 | 46.3 |
| Warriors | 2019 | 22 | 9 | 12 | 1 | 41% | 2 | - | - | - | 8 | - | - | - | 38 | 648 | 22 | 860 | 56 | 93.89% | 1,893 | 86.00 | 18 | 1,055 | 48.0 |
| Warriors | 2020 | 12 | 5 | 7 | - | 42% | 1 | - | - | - | 4 | 25 | 2.06 | - | 22 | 706 | 27 | 401 | 32 | 92.61% | 1,631 | 135.00 | 45 | 608 | 50.7 |
| Warriors | 2021 | 22 | 8 | 14 | - | 36% | 1 | - | - | - | 4 | 3 | 0.15 | - | 18 | 672 | 21 | 702 | 59 | 92.25% | 1,742 | 79.00 | 19 | 867 | 39.4 |
| Warriors | 2022 | 17 | 4 | 13 | - | 24% | 1 | - | - | - | 4 | 11 | 0.65 | 1 | 21 | 621 | 19 | 555 | 33 | 94.39% | 1,480 | 87.00 | 21 | 747 | 43.9 |
| Warriors | 2023 | 11 | 7 | 4 | - | 64% | 1 | - | - | - | 4 | - | - | - | 13 | 329 | 6 | 276 | 20 | 93.24% | 1,044 | 94.00 | 35 | 379 | 34.4 |
| Warriors | 2024 | 4 | 3 | - | 1 | 75% | 1 | - | - | - | 4 | - | - | - | 5 | 117 | - | 59 | 4 | 93.65% | 296 | 74.00 | 11 | 103 | 25.8 |
Career Overall
| Year Start | Year End | Played | Won | Lost | Drawn | Win % | Tries | Goals | 1 Point Field Goals | 2 Point Field Goals | Points | Kicking Metres | Kicking Metres Average | Forced Drop Outs | Tackle Breaks | Post Contact Metres | Offloads | Tackles Made | Missed Tackles | Tackle Efficiency | Total Running Metres | Average Running Metres | Kick Return Metres | Total Points | Average Points | |
|---|---|---|---|---|---|---|---|---|---|---|---|---|---|---|---|---|---|---|---|---|---|---|---|---|---|---|
| Warriors | 2016 | 2024 | 123 | 51 | 70 | 2 | 41% | 9 | - | - | - | 36 | 54 | 0.43 | 1 | 171 | 3,436 | 136 | 3,653 | 279 | 92.90% | 9,459 | 75.00 | 156 | 4,703 | 38.2 |
Latest
Team Mates

National Rugby League respects and honours the Traditional Custodians of the land and pay our respects to their Elders past, present and future. We acknowledge the stories, traditions and living cultures of Aboriginal and Torres Strait Islander peoples on the lands we meet, gather and play on.
