
The most comprehensive analysis of injuries undertaken in the history of the game reveals the rate of injuries in the NRL has remained stable in recent seasons, and has decreased over the past five years.
The NRL this week presented to clubs a 75-page Injury Surveillance Report, including detailed information on injuries throughout the NRL and revealing to each club their ranking among the competition in terms of handling various injuries.
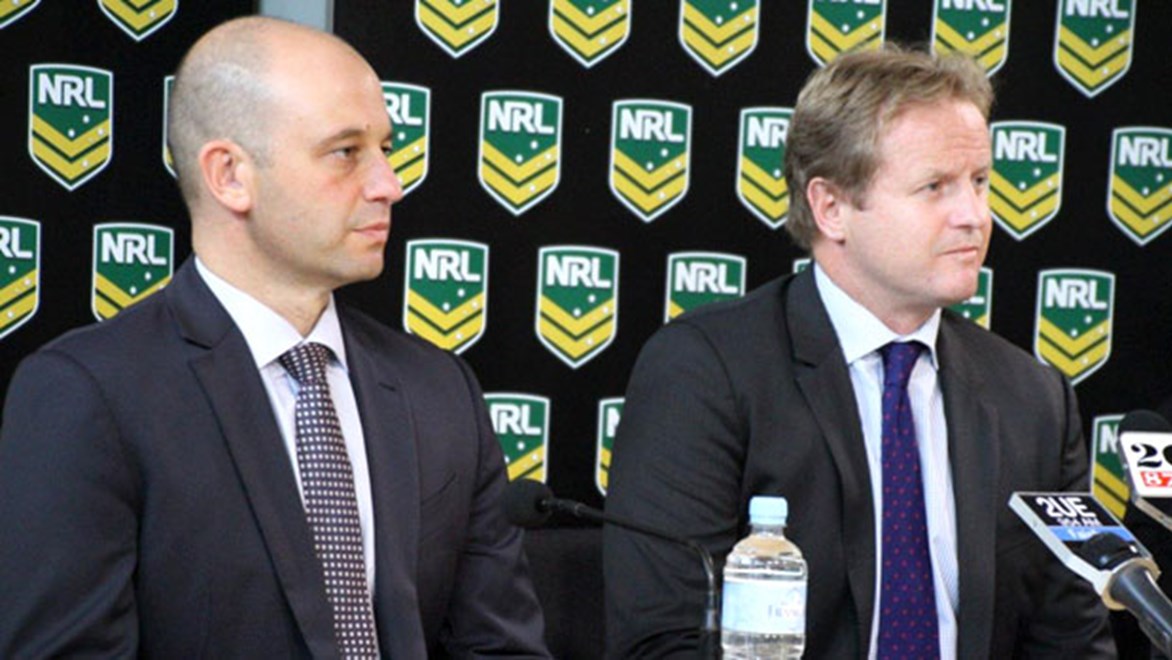
"What it is is a report for all 16 clubs that takes into account injury surveillance over the course of the season," the NRL's Head of Football, Todd Greenberg, told NRL.com.
"It's really important; it really goes to player safety for all of our clubs.
"It also gives our clubs the opportunity to benchmark themselves against their counterparts across every metric in the game. Ultimately it's about what we're all looking for, which is player safety."
The report shows that the rate of players picking up any injury in NRL games has remained stable over the past three seasons, with 47.8 injuries every 1000 playing hours in 2014, compared with 45.4 per 100 hours in 2013 and 47.6 per 1000 hours in 2012.
Those numbers are a significant drop over previous years, when there were 64 injuries per 1000 playing hours in 2011, 72.4 per 1000 hours in 2010 and 67.9 per 1000 hours in 2009.
The number of players missing games through injuries dropped last season, with 1943 missed games in 2014 compared to 2141 in 2013. The rate of players picking up an injury in a match and missing at least one game has decreased steadily over the past five years, from 34.2 such injuries per 1000 playing hours last season compared to 62.9 per 1000 hours back in 2010.
In 2014 there was a 3.9% risk of players sustaining an injury that would rule them out of a game, down from 4.2% in 2012 and 6% in 2011.
Greenberg said that the report can help the NRL and clubs act to further protect players in coming seasons.
"This certainly allows us to look at workload. It certainly allows us to look at player recovery times, and allows us to shape that across the game for the trends of the game, not just individual clubs," he said.
"So whilst individual clubs will be very interested to see their metrics as opposed to their counterparts, it allows us to have a look at trends inside the game. Ultimately that information will help us shape key decisions."
The rate of reported concussions increased last year – due in part to the implementation of the NRL policy for sideline concussion assessment.
"This year for the first time in the game's history, we've got a sideline concussion assessment policy," Greenberg said. "We know exactly how many players came off the field last year and were assessed under that policy. We know exactly the number of players that went back on, and we know the exact data about that in relation to SCAT tests."
The report also found that non-contact injuries account for 24.6% of all injuries, and that there was no significant difference between older or younger players when it came to sustaining injuries, or any significant increase in the number of injuries in NRL rounds following a representative match.

