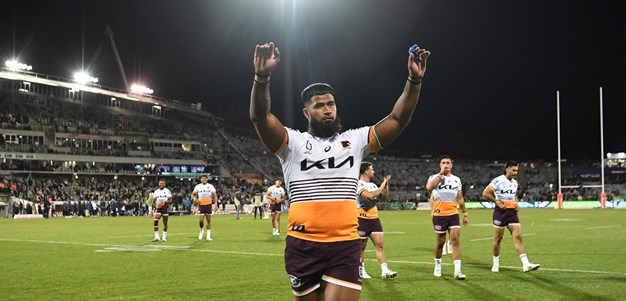
You have skipped the navigation, tab for page content


Andrew Fifita
Prop
Retired
Player Bio
- Date of Birth:
- 28 June 1989
- Birthplace:
- Blacktown, NSW
- Nickname:
- -
- Debut Club:
- Wests Tigers
- Date:
- 21 March 2010
- Opposition:
- Sydney Roosters
- Round:
- 2
- Previous Clubs:
- Wests Tigers, Cronulla-Sutherland Sharks
- Junior Club:
- Griffith Waratah, St Patricks Blacktown
- Biography:
The father of three young children, played for his father’s homeland of Tonga in 10 Tests, including at the 2017 World Cup, was a NSW rep in 2013, 2015-16 and 17, while also representing Australia in seven Test matches. A member of the Sharks Premiership-winning side of 2016, scoring the winning try. Injury plagued his 2020 season but will be looking to bounce back to his best in 2021.
Playing
- Appearances
- 251
- Points
- 160
- Tries
- 40
Career By Season
| Year | Played | Won | Lost | Drawn | Win % | Tries | Goals | 1 Point Field Goals | 2 Point Field Goals | Points | Kicking Metres | Kicking Metres Average | Forced Drop Outs | Tackle Breaks | Post Contact Metres | Offloads | Tackles Made | Missed Tackles | Tackle Efficiency | Total Running Metres | Average Running Metres | Kick Return Metres | Total Points | Average Points | |
|---|---|---|---|---|---|---|---|---|---|---|---|---|---|---|---|---|---|---|---|---|---|---|---|---|---|
| Wests Tigers | 2010 | 22 | 12 | 10 | - | 55% | 5 | - | - | - | 20 | - | - | - | 81 | - | 6 | 342 | 38 | 86.42% | 1,558 | 70.00 | - | - | - |
| Wests Tigers | 2011 | 17 | 8 | 9 | - | 47% | 3 | - | - | - | 12 | 23 | 1.35 | - | 76 | - | 8 | 421 | 29 | 88.72% | 1,291 | 75.00 | - | - | - |
| Sharks | 2012 | 22 | 10 | 11 | 1 | 45% | 5 | - | - | - | 20 | 21 | 0.95 | - | 76 | - | 10 | 593 | 30 | 95.18% | 2,367 | 107.00 | - | - | - |
| Sharks | 2013 | 25 | 14 | 11 | - | 56% | 9 | - | - | - | 36 | 46 | 1.82 | - | 89 | 1,295 | 33 | 856 | 18 | 96.07% | 3,982 | 159.00 | 658 | 1,626 | 65.0 |
| Sharks | 2014 | 12 | 3 | 9 | - | 25% | - | - | - | - | - | 13 | 1.12 | 1 | 63 | 528 | 37 | 385 | 19 | 92.77% | 1,801 | 150.00 | 320 | 658 | 54.8 |
| Sharks | 2015 | 18 | 10 | 8 | - | 56% | 7 | - | - | - | 28 | - | - | - | 79 | 1,114 | 34 | 551 | 34 | 94.19% | 2,983 | 165.00 | 437 | 1,111 | 61.7 |
| Sharks | 2016 | 25 | 18 | 6 | 1 | 72% | 3 | - | - | - | 12 | 6 | 0.23 | - | 126 | 1,333 | 70 | 744 | 20 | 93.33% | 4,289 | 171.00 | 977 | 1,607 | 64.3 |
| Sharks | 2017 | 23 | 13 | 10 | - | 57% | 1 | - | - | - | 4 | - | - | - | 94 | 1,147 | 53 | 671 | 42 | 94.11% | 3,348 | 145.00 | 604 | 1,237 | 53.8 |
| Sharks | 2018 | 26 | 16 | 10 | - | 62% | 3 | - | - | - | 12 | - | - | - | 117 | 1,150 | 82 | 772 | 42 | 94.84% | 3,496 | 134.00 | 534 | 1,483 | 57.0 |
| Sharks | 2019 | 21 | 10 | 11 | - | 48% | 2 | - | - | - | 8 | 17 | 0.81 | 1 | 77 | 611 | 53 | 610 | 30 | 95.31% | 2,416 | 115.00 | 436 | 1,083 | 51.6 |
| Sharks | 2020 | 12 | 5 | 7 | - | 42% | 1 | - | - | - | 4 | - | - | - | 41 | 419 | 17 | 223 | 11 | 95.30% | 1,313 | 109.00 | 353 | 481 | 40.1 |
| Sharks | 2021 | 6 | 2 | 4 | - | 33% | - | - | - | - | - | - | - | - | 12 | 122 | 1 | 59 | 4 | 93.65% | 325 | 54.00 | 90 | 120 | 20.0 |
| Sharks | 2022 | 22 | 16 | 6 | - | 73% | 1 | - | - | - | 4 | 21 | 0.94 | - | 44 | 517 | 22 | 299 | 8 | 97.39% | 1,412 | 64.00 | 396 | 577 | 26.2 |
Career Overall
| Year Start | Year End | Played | Won | Lost | Drawn | Win % | Tries | Goals | 1 Point Field Goals | 2 Point Field Goals | Points | Kicking Metres | Kicking Metres Average | Forced Drop Outs | Tackle Breaks | Post Contact Metres | Offloads | Tackles Made | Missed Tackles | Tackle Efficiency | Total Running Metres | Average Running Metres | Kick Return Metres | Total Points | Average Points | |
|---|---|---|---|---|---|---|---|---|---|---|---|---|---|---|---|---|---|---|---|---|---|---|---|---|---|---|
| Wests Tigers | 2010 | 2011 | 39 | 20 | 19 | - | 51% | 8 | - | - | - | 32 | 23 | 0.59 | - | 157 | - | 14 | 763 | 67 | 91.93% | 2,849 | 73.00 | - | - | - |
| Sharks | 2012 | 2022 | 212 | 117 | 93 | 2 | 55% | 32 | - | - | - | 128 | 123 | 0.58 | 2 | 818 | 8,067 | 412 | 5,646 | 258 | 95.63% | 27,116 | 127.00 | 4,655 | 9,794 | 51.6 |
Latest

National Rugby League respects and honours the Traditional Custodians of the land and pay our respects to their Elders past, present and future. We acknowledge the stories, traditions and living cultures of Aboriginal and Torres Strait Islander peoples on the lands we meet, gather and play on.
