
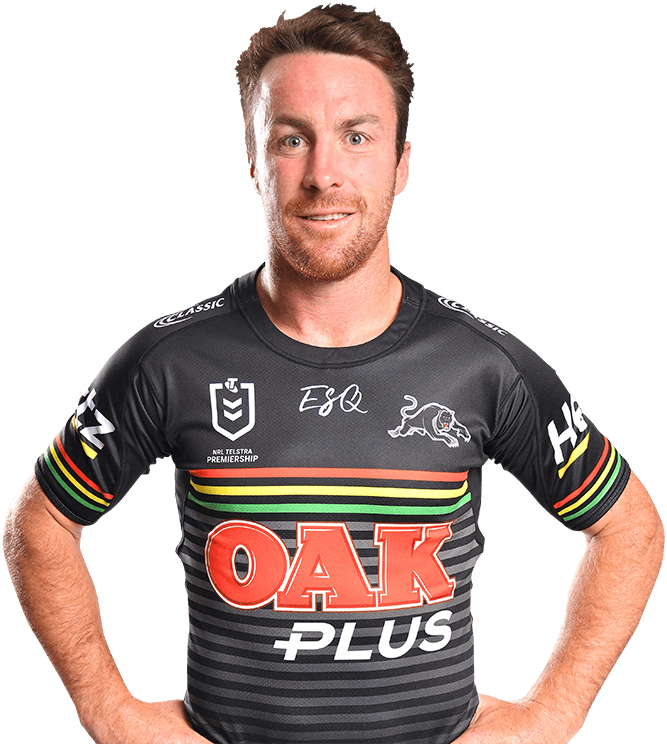
James Maloney
Five-Eighth
Retired
Player Bio
- Date of Birth:
- 15 June 1986
- Birthplace:
- Orange, NSW
- Nickname:
- Jimmy
- Debut Club:
- Melbourne Storm
- Date:
- 11 April 2009
- Opposition:
- Penrith Panthers
- Round:
- 5
- Previous Clubs:
- Melbourne Storm, New Zealand Warriors, Sydney Roosters, Cronulla-Sutherland Sharks, Penrith Panthers
- Junior Club:
- St Edwards
- Biography:
Maloney played more than 300 matches for Melbourne Storm, the Warriors, Roosters, Sharks, Panthers and Catalans Dragons, as well as 14 Origins for NSW and four Tests for Australia.
Maloney is a proven winner, having helped steer the Roosters to 2013 premiership and the Sharks to their inaugural grand final win in 2016. He was also a member of the Warriors team which lost the 2011 decider to Manly.
Maloney is the No.11 points scorer in NRL history with 1825 points.
Playing
- Appearances
- 247
- Points
- 1825
- Tries
- 64
Career By Season
| Year | Played | Won | Lost | Drawn | Win % | Tries | Goals | 1 Point Field Goals | 2 Point Field Goals | Points | Kicking Metres | Kicking Metres Average | Goal Conversion Rate | Forced Drop Outs | Try Assists | Offloads | Receipts | Tackles Made | Missed Tackles | Tackle Efficiency | Total Running Metres | Average Running Metres | Kick Return Metres | Total Points | Average Points | |
|---|---|---|---|---|---|---|---|---|---|---|---|---|---|---|---|---|---|---|---|---|---|---|---|---|---|---|
| Storm | 2009 | 4 | 2 | 2 | - | 50% | - | - | - | - | - | 112 | 28.00 | - | - | - | - | - | 79 | 6 | 92.02% | 169 | 42.00 | - | - | - |
| Warriors | 2010 | 24 | 14 | 10 | - | 58% | 10 | 73 | - | - | 188 | 7,443 | 310.12 | 74.49% | - | 14 | 6 | - | 425 | 121 | 74.95% | 1,320 | 55.00 | 20 | - | - |
| Warriors | 2011 | 27 | 16 | 11 | - | 59% | 10 | 82 | - | - | 206 | 10,086 | 373.54 | 75.23% | - | 15 | 8 | 41 | 536 | 128 | 75.51% | 1,875 | 69.00 | 63 | - | - |
| Warriors | 2012 | 24 | 8 | 16 | - | 33% | 4 | 67 | - | - | 153 | 7,228 | 301.17 | 77.01% | - | 17 | 8 | - | 414 | 125 | 76.81% | 1,589 | 66.00 | 125 | - | - |
| Roosters | 2013 | 25 | 19 | 6 | - | 76% | 9 | 108 | - | - | 252 | 5,744 | 229.75 | 87.10% | 7 | 25 | 4 | 810 | 433 | 83 | 78.79% | 1,701 | 68.00 | 96 | 1,327 | 53.1 |
| Roosters | 2014 | 27 | 17 | 10 | - | 63% | 5 | 106 | - | - | 234 | 5,038 | 186.59 | 83.46% | 10 | 23 | 2 | 1,003 | 498 | 89 | 79.80% | 1,509 | 55.00 | 16 | 1,244 | 46.1 |
| Roosters | 2015 | 27 | 19 | 8 | - | 70% | 9 | 106 | - | - | 250 | 5,034 | 186.45 | 82.81% | 20 | 20 | 3 | 864 | 498 | 109 | 82.04% | 2,105 | 77.00 | 59 | 1,277 | 47.3 |
| Sharks | 2016 | 25 | 18 | 6 | 1 | 72% | 7 | 94 | - | - | 219 | 3,893 | 155.74 | 77.69% | 17 | 9 | 4 | 1,112 | 400 | 103 | 76.33% | 1,866 | 74.00 | 7 | 942 | 37.7 |
| Sharks | 2017 | 20 | 12 | 8 | - | 60% | 4 | 71 | - | - | 161 | 2,756 | 137.82 | 87.65% | 8 | 12 | 5 | 834 | 277 | 121 | 69.60% | 1,439 | 71.00 | 5 | 557 | 27.8 |
| Panthers | 2018 | 22 | 15 | 7 | - | 68% | 4 | 53 | - | - | 126 | 5,202 | 236.45 | 86.89% | 19 | 10 | 9 | 1,128 | 278 | 161 | 63.33% | 1,893 | 86.00 | 1 | 695 | 31.6 |
| Panthers | 2019 | 22 | 9 | 13 | - | 41% | 2 | 12 | 4 | - | 36 | 5,354 | 243.35 | 85.71% | 31 | 16 | 5 | 1,082 | 361 | 122 | 74.74% | 1,755 | 79.00 | 61 | 793 | 36.0 |
Career Overall
| Year Start | Year End | Played | Won | Lost | Drawn | Win % | Tries | Goals | 1 Point Field Goals | 2 Point Field Goals | Points | Kicking Metres | Kicking Metres Average | Goal Conversion Rate | Forced Drop Outs | Try Assists | Offloads | Receipts | Tackles Made | Missed Tackles | Tackle Efficiency | Total Running Metres | Average Running Metres | Kick Return Metres | Total Points | Average Points | |
|---|---|---|---|---|---|---|---|---|---|---|---|---|---|---|---|---|---|---|---|---|---|---|---|---|---|---|---|
| Storm | 2009 | 2009 | 4 | 2 | 2 | - | 50% | - | - | - | - | - | 112 | 28.00 | - | - | - | - | - | 79 | 6 | 92.94% | 169 | 42.00 | - | - | - |
| Warriors | 2010 | 2012 | 75 | 38 | 37 | - | 51% | 24 | 222 | - | - | 547 | 24,756 | 330.09 | 75.51% | - | 46 | 22 | 41 | 1,375 | 374 | 78.62% | 4,764 | 63.00 | 208 | - | - |
| Roosters | 2013 | 2015 | 79 | 55 | 24 | - | 70% | 23 | 320 | - | - | 736 | 15,816 | 200.20 | 84.43% | 37 | 68 | 9 | 2,677 | 1,429 | 281 | 83.57% | 5,316 | 67.00 | 172 | 3,838 | 48.6 |
| Sharks | 2016 | 2017 | 45 | 30 | 14 | 1 | 67% | 11 | 165 | - | - | 380 | 6,650 | 147.77 | 81.68% | 25 | 21 | 9 | 1,946 | 677 | 224 | 75.14% | 3,306 | 73.00 | 12 | 1,499 | 33.3 |
| Panthers | 2018 | 2019 | 44 | 24 | 20 | - | 55% | 6 | 65 | 4 | - | 162 | 10,556 | 239.90 | 86.67% | 50 | 26 | 14 | 2,210 | 639 | 282 | 69.38% | 3,649 | 82.00 | 62 | 1,490 | 33.9 |
Latest

National Rugby League respects and honours the Traditional Custodians of the land and pay our respects to their Elders past, present and future. We acknowledge the stories, traditions and living cultures of Aboriginal and Torres Strait Islander peoples on the lands we meet, gather and play on.


