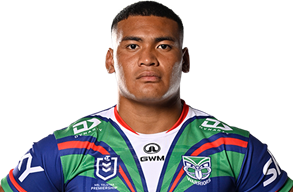

Shaun Johnson
Halfback
Player Bio
- Height:
- 179 cm
- Date of Birth:
- 09 September 1990
- Weight:
- 91 kg
- Birthplace:
- Auckland, NZ
- Age:
- 33
- Nickname:
- SJ
- Debut Club:
- New Zealand Warriors
- Date:
- 04 June 2011
- Opposition:
- Sydney Roosters
- Round:
- 13
- Previous Club:
- Cronulla-Sutherland Sharks
- Junior Clubs:
- Hibiscus Coast Raiders, Northcote Tigers
- Biography:
When Shaun was told by Cronulla Sutherland that he wouldn’t be retained beyond 2021, the Vodafone Warriors swooped to sign him to return to his original club, enabling him to resume his career after making 162 appearances for the Vodafone Warriors from 2011 to 2018.
At the time of his signing in June, Vodafone Warriors CEO Cameron George said: “While he left to join the Sharks (in 2018), Shaun’s heart has always been with the Vodafone Warriors after starting his career here.”
Shaun owns the Vodafone Warriors’ all-time record for most points (917) and also ranks among the club’s leading try scorers with 63. He'll start his ninth season with the club just 83 points short of becoming the first player to score 1000 points for the Vodafone Warriors.
After finishing with the Vodafone Warriors, Johnson made 40 appearances for the Sharks to lift his career tally to 202 games while he has now scored almost 1200 points in total.
After a delayed comeback to the 2021 season following an Achilles injury, SJ's presence saw the Sharks climb into the eight before a hamstring complaint ended his campaign (and with it Cronulla's top eight hopes).
He returned to New Zealand before the season finished, flying back to Queensland in mid-November to re-join his original club for preseason training.
Career
- Appearances
- 261
- Tries
- 84
2024 Season
- Appearances
- 9
Scoring
- Tries
- 4
- Goals
- 22
Kicking
- Forced Drop Outs
- 10
- Average Kicking Metres
- 578.3
- Goal Conversion Rate
-
Attack
- Try Assists
- 8
- Line Break Assists
- 9
Passing
- Offloads
- 4
- Receipts
- 595
Defence
- Tackles Made
- 175
- Tackle Efficiency
-
Running Metres
- Average Running Metres
- 83
- Total Running Metres
- 752
Fantasy
- Total Points
- 546
- Average Points
- 60.7
2024 Season - By Round
| Round | Opponent | Score | Position | Minutes Played | Tries | Goals | 1 Point Field Goals | 2 Point Field Goals | Points | Kicking Metres | Forced Drop Outs | Try Assists | Linebreaks | Tackle Breaks | Post Contact Metres | Offloads | Receipts | Tackles Made | Missed Tackles | Total Running Metres | Hit Up Running Metres | Kick Return Metres | |
|---|---|---|---|---|---|---|---|---|---|---|---|---|---|---|---|---|---|---|---|---|---|---|---|
| 1 | Sharks | Lost | 12 - 16 | Halfback | 80 | - | 2 | - | - | 4 | 500 | 5 | - | - | 1 | 7 | - | 68 | 19 | 4 | 113 | - | - |
| 2 | Storm | Lost | 30 - 26 | Halfback | 80 | - | - | - | - | - | 408 | - | - | - | - | - | - | 49 | 14 | 3 | 70 | - | - |
| 3 | Raiders | Won | 18 - 10 | Halfback | 80 | - | - | - | - | - | 662 | 1 | 1 | - | 1 | - | - | 59 | 25 | 6 | 45 | - | - |
| 4 | Knights | Won | 20 - 12 | Halfback | 80 | - | 4 | - | - | 8 | 624 | - | 1 | - | 2 | 5 | - | 75 | 23 | 3 | 77 | - | - |
| 5 | Rabbitohs | Won | 4 - 34 | Halfback | 72 | 2 | 5 | - | - | 18 | 633 | - | 2 | - | 2 | - | - | 56 | 10 | 1 | 88 | 11 | - |
| 6 | Sea Eagles | Drawn | 22 - 22 | Halfback | 90 | 1 | 3 | - | - | 10 | 666 | 1 | 1 | 1 | 4 | 13 | 1 | 92 | 13 | 3 | 147 | - | - |
| 7 | Dragons | Lost | 30 - 12 | Halfback | 77 | 1 | 2 | - | - | 8 | 500 | 1 | - | 1 | - | 1 | 1 | 58 | 29 | 4 | 81 | - | - |
| 8 | Titans | Lost | 24 - 27 | Halfback | 80 | - | 4 | - | - | 8 | 644 | - | 3 | - | - | 3 | - | 66 | 17 | 7 | 42 | - | - |
| 9 | Knights | Lost | 14 - 8 | Halfback | 80 | - | 2 | - | - | 4 | 568 | 2 | - | - | - | 9 | 2 | 72 | 25 | 4 | 86 | - | - |
Career By Season
| Year | Played | Won | Lost | Drawn | Win % | Tries | Goals | 1 Point Field Goals | 2 Point Field Goals | Points | Kicking Metres | Kicking Metres Average | Goal Conversion Rate | Forced Drop Outs | Try Assists | Offloads | Receipts | Tackles Made | Missed Tackles | Tackle Efficiency | Total Running Metres | Average Running Metres | Kick Return Metres | Total Points | Average Points | |
|---|---|---|---|---|---|---|---|---|---|---|---|---|---|---|---|---|---|---|---|---|---|---|---|---|---|---|
| Warriors | 2011 | 16 | 9 | 7 | - | 56% | 6 | - | - | - | 24 | 3,184 | 199.01 | - | - | 18 | 14 | 44 | 172 | 59 | 73.04% | 1,043 | 65.00 | 3 | - | - |
| Warriors | 2012 | 22 | 8 | 14 | - | 36% | 12 | - | - | - | 48 | 5,127 | 233.05 | - | - | 17 | 20 | - | 270 | 82 | 76.70% | 1,234 | 56.00 | 102 | - | - |
| Warriors | 2013 | 24 | 11 | 13 | - | 46% | 10 | 67 | - | - | 177 | 7,585 | 316.05 | 75.28% | 11 | 17 | 15 | 1,050 | 319 | 69 | 74.98% | 1,436 | 59.00 | 51 | 1,229 | 51.2 |
| Warriors | 2014 | 21 | 10 | 11 | - | 48% | 9 | 63 | - | - | 163 | 6,154 | 293.02 | 75.90% | 19 | 11 | 13 | 934 | 292 | 53 | 81.29% | 1,654 | 78.00 | 22 | 1,053 | 50.1 |
| Warriors | 2015 | 18 | 9 | 9 | - | 50% | 8 | 48 | - | - | 130 | 5,227 | 290.38 | 69.57% | 16 | 11 | 10 | 823 | 279 | 40 | 87.46% | 1,386 | 77.00 | 10 | 1,023 | 56.8 |
| Warriors | 2016 | 24 | 10 | 14 | - | 42% | 10 | 42 | - | - | 125 | 6,440 | 268.33 | 73.68% | 22 | 18 | 18 | 1,290 | 387 | 63 | 80.77% | 1,609 | 67.00 | 10 | 1,240 | 51.7 |
| Warriors | 2017 | 18 | 7 | 11 | - | 39% | 4 | 45 | - | - | 108 | 7,627 | 423.70 | 78.95% | 14 | 17 | 10 | 926 | 282 | 54 | 83.93% | 1,251 | 69.00 | 6 | 1,038 | 57.7 |
| Warriors | 2018 | 19 | 12 | 7 | - | 63% | 4 | 61 | - | - | 142 | 4,442 | 233.79 | 76.25% | 8 | 15 | 16 | 861 | 334 | 68 | 83.08% | 1,394 | 73.00 | - | 986 | 51.9 |
| Sharks | 2019 | 18 | 8 | 10 | - | 44% | 3 | 45 | - | - | 102 | 4,632 | 257.31 | 76.27% | 15 | 16 | 12 | 789 | 260 | 35 | 88.14% | 1,269 | 70.00 | 13 | 899 | 49.9 |
| Sharks | 2020 | 16 | 9 | 7 | - | 56% | 2 | 56 | - | - | 120 | 4,731 | 295.71 | 76.71% | 18 | 23 | 8 | 806 | 243 | 41 | 85.56% | 1,154 | 72.00 | 35 | 858 | 53.6 |
| Sharks | 2021 | 10 | 5 | 5 | - | 50% | 1 | 18 | 1 | - | 41 | 3,690 | 368.97 | 90.00% | 15 | 5 | 6 | 586 | 125 | 25 | 83.33% | 669 | 66.00 | - | 479 | 47.9 |
| Warriors | 2022 | 21 | 5 | 16 | - | 24% | 3 | 14 | 2 | - | 42 | 7,224 | 344.02 | 77.78% | 23 | 14 | 8 | 1,127 | 334 | 46 | 87.89% | 1,044 | 49.00 | 6 | 826 | 39.3 |
| Warriors | 2023 | 25 | 17 | 8 | - | 68% | 8 | 71 | 2 | - | 176 | 13,100 | 524.00 | 79.78% | 24 | 29 | 9 | 1,582 | 455 | 46 | 90.82% | 1,514 | 60.00 | 53 | 1,535 | 61.4 |
| Warriors | 2024 | 9 | 3 | 5 | 1 | 33% | 4 | 22 | - | - | 60 | 5,205 | 578.31 | 88.00% | 10 | 8 | 4 | 595 | 175 | 35 | 83.33% | 752 | 83.00 | - | 546 | 60.7 |
Career Overall
| Year Start | Year End | Played | Won | Lost | Drawn | Win % | Tries | Goals | 1 Point Field Goals | 2 Point Field Goals | Points | Kicking Metres | Kicking Metres Average | Goal Conversion Rate | Forced Drop Outs | Try Assists | Offloads | Receipts | Tackles Made | Missed Tackles | Tackle Efficiency | Total Running Metres | Average Running Metres | Kick Return Metres | Total Points | Average Points | |
|---|---|---|---|---|---|---|---|---|---|---|---|---|---|---|---|---|---|---|---|---|---|---|---|---|---|---|---|
| Warriors |
2011
2022 |
2018
2024 |
217 | 101 | 115 | 1 | 47% | 78 | 433 | 4 | - | 1,195 | 71,315 | 328.64 | 76.37% | 147 | 175 | 137 | 9,232 | 3,299 | 615 | 84.29% | 14,323 | 66.00 | 266 | 9,474 | 52.9 |
| Sharks | 2019 | 2021 | 44 | 22 | 22 | - | 50% | 6 | 119 | 1 | - | 263 | 13,053 | 296.65 | 78.29% | 48 | 44 | 26 | 2,181 | 454 | 101 | 81.80% | 2,714 | 61.00 | 48 | 2,024 | 46.0 |
Latest
Team Mates

National Rugby League respects and honours the Traditional Custodians of the land and pay our respects to their Elders past, present and future. We acknowledge the stories, traditions and living cultures of Aboriginal and Torres Strait Islander peoples on the lands we meet, gather and play on.


