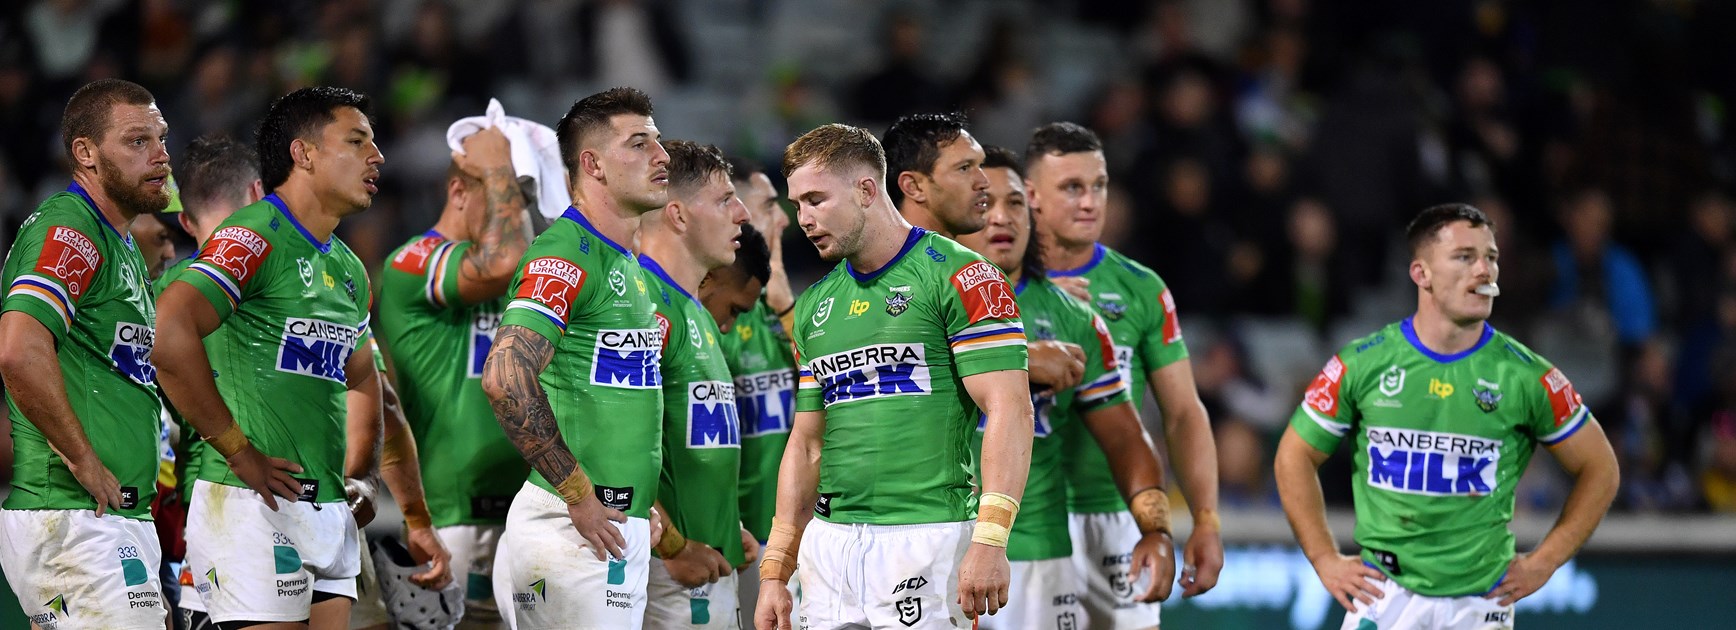
It's no secret the Green Machine has been falling away in second halves this year but an NRL.com Stats analysis has revealed just how stark the numbers are.
The bad news for Raiders fans is there's no one specific area letting them down, or an easy fix.
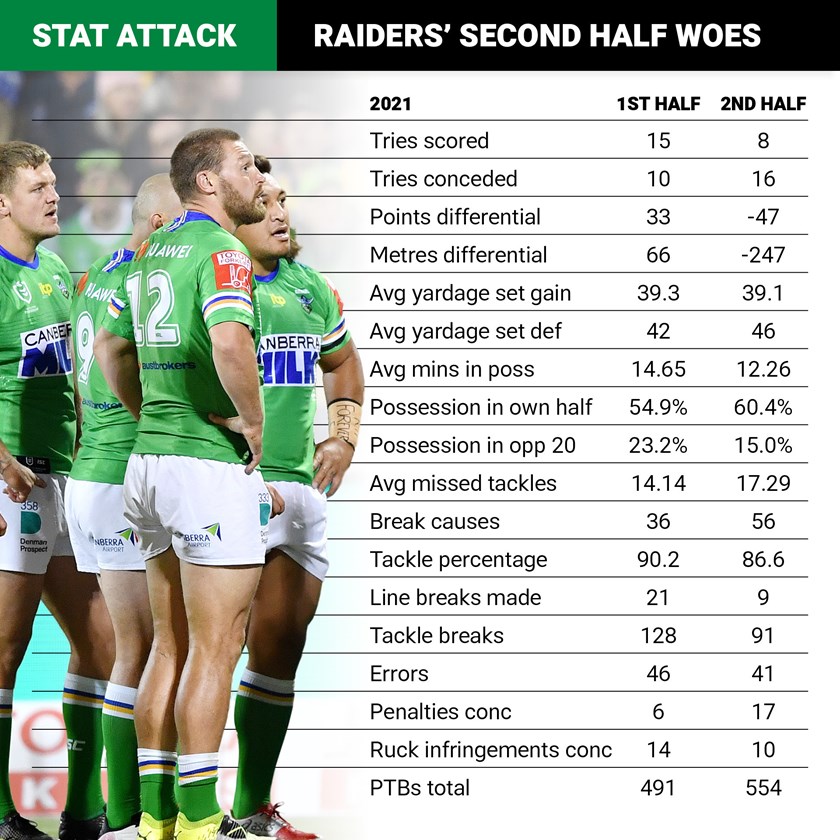
Across the second 40 minutes of their seven games the Raiders have less ball, make fewer metres, concede more metres, spend more time in their own half, make fewer tackle busts and line breaks, miss more tackles and quite obviously score fewer points while conceding more.
The team actually makes slightly fewer errors in second halves, though they concede almost three times as many penalties. They struggle more with opposition kicks and get worse results from their own.
Coach Ricky Stuart knows full well something needs fixing.
"I've identified areas of the matches we've played in where it's got away from us," Stuart said this week.

"We've spoken about that. But it's not a fatigue thing. Sometimes games don't go your way. A couple of the games we were beaten by a couple of better teams. A few games – the Warriors, the Cowboys – the flow of the game was completely different to the first half.
"We've identified a lot of areas in those second halves why we've fallen away."
Running game and defence
The Raiders average 864 metres gained in first halves while conceding 798 metres, for a +66 differential. In second halves they make just 679 metres on average while conceding a whopping 926 for a costly -247 metres per game.
Part of that is possession, which we'll get to shortly, but rival teams are simply charging upfield much more easily after half time against the Green Machine.
While Canberra's own yardage sets with the ball yield little difference either side of the break (39.3 metres gained per set in first halves and 39.1 in the second), there is a big jump when rivals have the ball.
Canberra's opposition makes 42 metres per yardage set in first halves but a huge 46 metres per yardage set after half-time.
No doubt the increase from 14.3 missed tackles per half to 17.3 is an increase in that increased opposition yardage game, along with a jump from 36 line break causes to 56.
Their overall effective tackle percentage drops from 90.2 per cent to 86.6 per cent in second halves.
And while the Raiders maintain their own yardage work after half-time, the sting goes out of their carries – they have 128 first-half tackle busts but just 91 in the second, a drop-off of close to one third.
This is borne out particularly in their line-break tally, with 21 made in first halves and just nine in second halves.
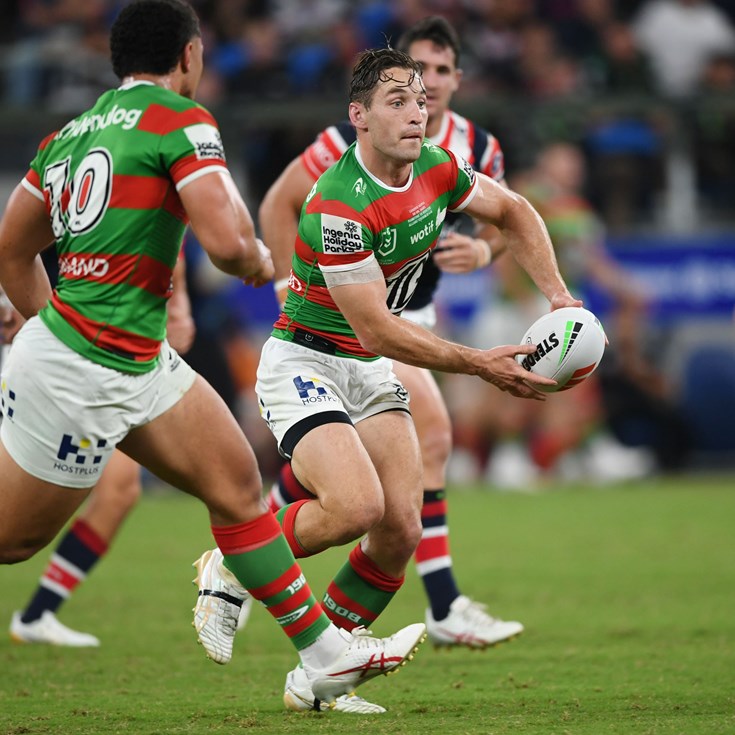
Raiders v Rabbitohs - Round 8
Kicking game and kick defence
There's a slight drop-off in Canberra's total metres gained from kicks (their first half average of 295 slips to 271 in second halves) but that could be as simple as not having as much ball.
However, their kick outcomes are poorer while opposition kick outcomes get better.
The Raiders have forced six first-half drop outs and just two in second halves all year, while opponents have forced two more (nine versus seven) in second halves.
Canberra's kick defusal also slips in second halves from 78.1 per cent to 67.4 per cent.
Ricky Stuart wants old Papalii back
Negative play
As mentioned up top, errors aren't Canberra's second-half problem. Their total first half handling errors of 46 go down slightly to 41 in second halves.
Ruck infringements also go down a little, with 14 conceded in first halves compared to 10 in second halves.
However their discipline in terms of penalties goes out the window, with just six in first halves conceded across seven games almost tripling to 17 in second halves.
They are the second-best behaved first half team after Penrith (five first half penalties) but equal third-worst in second halves behind only Canterbury (22) and Gold Coast (18).
Annesley vehemently drives change to foul play
Possession and points
Canberra average 14.65 minutes of live game time with the ball in first halves but that drops to just 12.26 in second halves.
The time with the ball they do have is in better field position in first halves too, with 45.1 per cent of their possession coming with them in opposition territory. Just 39.6 per cent of the reduced ball they do have in second halves comes in opposition territory.
Attacking ball similarly slips, with 23.2 per cent of their first half time in possession coming with them attacking inside the opposition 20-metre zone but this drops to just 15 per cent of their time with the ball coming in their rivals' red-zone after half time.
The flow-on effect from all of that onto the score line is obvious.
Canberra is outscoring opponents 15 tries to 10 in first halves but losing the second stanza by a whopping 16 tries to eight, with a +33 first half differential collapsing to -47 points in the second half.
It was particularly costly in rounds three and seven as the Warriors and Cowboys staged big comebacks (though admittedly there was a horror injury toll in round three) and in round six as an even contest against Parramatta turned into a one-sided Eels win.
NRL Magic Round Brisbane 1-Day & 3-Day Passes are now on sale with eight massive games across round 10 at Suncorp Stadium this May. With the league's best players all heading to Brisbane, you'd hate to miss it! Tickets at NRL.com/Tickets


