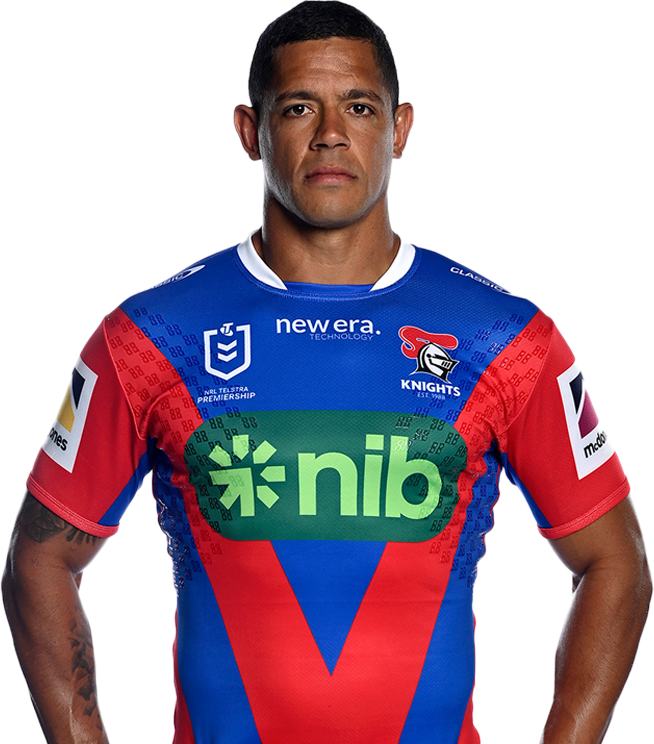

Dane Gagai
Centre
Player Bio
- Height:
- 182 cm
- Date of Birth:
- 03 January 1991
- Weight:
- 92 kg
- Birthplace:
- Mackay, QLD
- Age:
- 33
- Nickname:
- Gags
- Debut Club:
- Brisbane Broncos
- Date:
- 11 March 2011
- Opposition:
- North Queensland Cowboys
- Round:
- 1
- Previous Clubs:
- Brisbane Broncos, South Sydney Rabbitohs
- Junior Club:
- Souths Sharks
- Biography:
Knight #235
A highly regarded centre and experienced representative player, Dane Gagai returned to the Knights at the start of the 2022 season.
After making his debut for the Broncos, 'Gags' linked up with the Knights in 2012 where he went onto play 128 games in the red and blue before joining South Sydney in 2018.
A highly-capped Queensland Origin and Australian representative, plus 2017 Wally Lewis Medal winner, Gagai is signed on until at least the end of the 2026 season with a mutual option for a further season.
In 2023, Gagai formed a lethal right edge attack making 22 appearances which included his milestone 250th game in the NRL. The centre was honoured with a Life Membership at the Club.
Career
- Appearances
- 283
- Tries
- 82
2024 Season
- Appearances
- 15
Scoring
- Tries
- 5
- Goals
- 10
Kicking
- Goal Conversion Rate
-
Attack
- Try Assists
- 2
- Line Breaks
- 9
- Tackle Breaks
- 103
Passing
- Receipts
- 279
Defence
- Tackles Made
- 288
- Missed Tackles
- 57
- Tackle Efficiency
-
Running Metres
- Average Running Metres
- 148
- Total Running Metres
- 2226
Fantasy
- Total Points
- 766
- Average Points
- 51.1
2024 Season - By Round
| Round | Opponent | Score | Position | Minutes Played | Tries | Goals | 1 Point Field Goals | 2 Point Field Goals | Points | Kicking Metres | Forced Drop Outs | Try Assists | Linebreaks | Tackle Breaks | Post Contact Metres | Offloads | Receipts | Tackles Made | Missed Tackles | Total Running Metres | Hit Up Running Metres | Kick Return Metres | |
|---|---|---|---|---|---|---|---|---|---|---|---|---|---|---|---|---|---|---|---|---|---|---|---|
| 1 | Raiders | Lost | 12 - 28 | Centre | 80 | - | - | - | - | - | 29 | - | - | - | 5 | 77 | - | 25 | 14 | - | 210 | 28 | - |
| 2 | Cowboys | Lost | 21 - 20 | Centre | 82 | - | - | - | - | - | - | - | - | 1 | 9 | 39 | 1 | 16 | 16 | 2 | 131 | 16 | - |
| 3 | Storm | Won | 14 - 12 | Centre | 80 | 1 | - | - | - | 4 | 20 | 1 | - | 1 | 7 | 35 | - | 20 | 23 | 6 | 136 | 6 | - |
| 5 | Dragons | Won | 30 - 10 | Centre | 80 | - | - | - | - | - | - | - | - | - | 1 | 44 | - | 14 | 28 | 5 | 99 | 9 | - |
| 6 | Roosters | Lost | 20 - 22 | Centre | 80 | - | 2 | - | - | 4 | - | - | - | - | 2 | 66 | - | 18 | 20 | 9 | 157 | 10 | - |
| 8 | Dolphins | Won | 14 - 18 | Centre | 80 | 1 | 3 | - | - | 10 | - | - | - | 1 | 6 | 45 | - | 13 | 24 | 1 | 100 | 10 | - |
| 9 | Warriors | Won | 14 - 8 | Centre | 80 | - | 3 | - | - | 6 | 4 | - | - | 1 | 10 | 40 | - | 23 | 19 | 2 | 132 | 6 | 10 |
| 10 | Wests Tigers | Won | 14 - 20 | Centre | 80 | - | 2 | - | - | 4 | 13 | - | 1 | - | 5 | 32 | - | 17 | 17 | 3 | 130 | - | 20 |
| 11 | Titans | Won | 24 - 28 | Centre | 80 | - | - | - | - | - | - | - | - | 1 | 5 | 57 | 1 | 16 | 21 | 3 | 167 | - | 2 |
| 13 | Bulldogs | Lost | 2 - 32 | Centre | 80 | - | - | - | - | - | - | - | - | - | 11 | 40 | - | 17 | 16 | 4 | 131 | 18 | - |
| 14 | Storm | Lost | 36 - 28 | Centre | 80 | 1 | - | - | - | 4 | - | - | - | 2 | 8 | 66 | 1 | 19 | 19 | 4 | 246 | 13 | - |
| 15 | Panthers | Lost | 18 - 26 | Centre | 80 | - | - | - | - | - | - | - | - | - | 8 | 34 | 1 | 16 | 18 | 3 | 117 | - | - |
| 17 | Eels | Won | 34 - 26 | Centre | 80 | - | - | - | - | - | 7 | - | 1 | - | 8 | 37 | - | 19 | 20 | 7 | 106 | - | 3 |
| 18 | Raiders | Won | 12 - 16 | Centre | 80 | 2 | - | - | - | 8 | - | - | - | 2 | 10 | 63 | 2 | 26 | 10 | 4 | 213 | 11 | 2 |
| 20 | Broncos | Lost | 14 - 30 | Centre | 80 | - | - | - | - | - | - | - | - | - | 8 | 42 | 1 | 20 | 23 | 4 | 144 | - | - |
Career By Season
| Year | Played | Won | Lost | Drawn | Win % | Tries | Goals | 1 Point Field Goals | 2 Point Field Goals | Points | Kicking Metres | Kicking Metres Average | Goal Conversion Rate | Forced Drop Outs | Try Assists | Linebreaks | Receipts | Tackles Made | Missed Tackles | Tackle Efficiency | Total Running Metres | Average Running Metres | Kick Return Metres | Total Points | Average Points | |
|---|---|---|---|---|---|---|---|---|---|---|---|---|---|---|---|---|---|---|---|---|---|---|---|---|---|---|
| Broncos | 2011 | 6 | 3 | 3 | - | 50% | 4 | - | - | - | 16 | - | - | - | - | - | 3 | - | 29 | 8 | 66.82% | 683 | 113.00 | 198 | - | - |
| Knights | 2012 | 12 | 6 | 6 | - | 50% | 5 | - | - | - | 20 | 188 | 15.67 | - | - | 6 | 7 | - | 177 | 38 | 82.33% | 1,381 | 115.00 | 34 | - | - |
| Knights | 2013 | 23 | 11 | 11 | 1 | 48% | 5 | - | - | - | 20 | 184 | 7.99 | - | - | 7 | 5 | 431 | 252 | 62 | 74.26% | 3,067 | 133.00 | 54 | 744 | 32.4 |
| Knights | 2014 | 24 | 10 | 14 | - | 42% | 7 | 1 | - | - | 30 | 101 | 4.20 | 50.00% | 1 | 5 | 8 | 493 | 313 | 71 | 75.37% | 3,411 | 142.00 | 145 | 685 | 28.5 |
| Knights | 2015 | 24 | 8 | 16 | - | 33% | 7 | 2 | - | - | 32 | 208 | 8.67 | 100.00% | - | 9 | 14 | 527 | 254 | 63 | 80.13% | 3,216 | 134.00 | 467 | 881 | 36.7 |
| Knights | 2016 | 22 | 1 | 20 | 1 | 5% | 3 | - | - | - | 12 | 214 | 9.72 | - | 3 | 4 | 8 | 542 | 208 | 62 | 73.81% | 2,663 | 121.00 | 575 | 726 | 33.0 |
| Knights | 2017 | 23 | 5 | 18 | - | 22% | 2 | - | - | - | 8 | 212 | 9.23 | - | 1 | 9 | 10 | 400 | 294 | 77 | 79.25% | 3,097 | 134.00 | 318 | 973 | 42.3 |
| Rabbitohs | 2018 | 25 | 15 | 10 | - | 60% | 4 | - | - | - | 16 | 119 | 4.76 | - | 1 | 10 | 5 | 477 | 406 | 87 | 82.35% | 2,835 | 113.00 | 262 | 881 | 35.2 |
| Rabbitohs | 2019 | 25 | 17 | 8 | - | 68% | 10 | 7 | - | - | 54 | 64 | 2.58 | 77.78% | - | 3 | 8 | 408 | 286 | 62 | 82.18% | 2,835 | 113.00 | 247 | 847 | 33.9 |
| Rabbitohs | 2020 | 19 | 12 | 7 | - | 63% | 11 | 1 | - | - | 46 | 59 | 3.13 | 100.00% | 1 | 2 | 15 | 334 | 216 | 29 | 88.16% | 2,623 | 138.00 | 188 | 753 | 39.6 |
| Rabbitohs | 2021 | 23 | 18 | 5 | - | 78% | 10 | - | - | - | 40 | 79 | 3.45 | - | - | 14 | 15 | 440 | 333 | 49 | 87.17% | 3,032 | 131.00 | 127 | 1,073 | 46.6 |
| Knights | 2022 | 20 | 5 | 15 | - | 25% | 5 | - | - | - | 20 | 114 | 5.69 | - | 1 | 6 | 8 | 375 | 357 | 88 | 80.22% | 2,583 | 129.00 | 80 | 781 | 39.0 |
| Knights | 2023 | 22 | 12 | 9 | 1 | 55% | 4 | 1 | - | - | 18 | 57 | 2.59 | 33.33% | - | 13 | 12 | 471 | 381 | 74 | 83.74% | 3,700 | 168.00 | 122 | 1,166 | 53.0 |
| Knights | 2024 | 15 | 8 | 7 | - | 53% | 5 | 10 | - | - | 40 | 74 | 4.95 | 71.43% | 1 | 2 | 9 | 279 | 288 | 57 | 83.48% | 2,226 | 148.00 | 39 | 766 | 51.1 |
Career Overall
| Year Start | Year End | Played | Won | Lost | Drawn | Win % | Tries | Goals | 1 Point Field Goals | 2 Point Field Goals | Points | Kicking Metres | Kicking Metres Average | Goal Conversion Rate | Forced Drop Outs | Try Assists | Linebreaks | Receipts | Tackles Made | Missed Tackles | Tackle Efficiency | Total Running Metres | Average Running Metres | Kick Return Metres | Total Points | Average Points | |
|---|---|---|---|---|---|---|---|---|---|---|---|---|---|---|---|---|---|---|---|---|---|---|---|---|---|---|---|
| Broncos | 2011 | 2011 | 6 | 3 | 3 | - | 50% | 4 | - | - | - | 16 | - | - | - | - | - | 3 | - | 29 | 8 | 78.38% | 683 | 113.00 | 198 | - | - |
| Knights |
2012
2022 |
2017
2024 |
185 | 66 | 116 | 3 | 36% | 43 | 14 | - | - | 200 | 1,352 | 7.31 | 60.87% | 7 | 61 | 81 | 3,518 | 2,524 | 592 | 81.00% | 25,348 | 137.00 | 1,836 | 6,704 | 38.8 |
| Rabbitohs | 2018 | 2021 | 92 | 62 | 30 | - | 67% | 35 | 8 | - | - | 156 | 322 | 3.50 | 66.67% | 2 | 29 | 43 | 1,657 | 1,240 | 227 | 84.53% | 11,309 | 122.00 | 824 | 3,552 | 38.6 |
Latest
Team Mates

National Rugby League respects and honours the Traditional Custodians of the land and pay our respects to their Elders past, present and future. We acknowledge the stories, traditions and living cultures of Aboriginal and Torres Strait Islander peoples on the lands we meet, gather and play on.


