King sees bright future at Blues
It is widely accepted centre is the toughest place to defend on the field, so who were the best and worst defensive centres in the NRL in 2017 and how did they affect their team's fortunes?
NRL.com Stats has crunched the numbers – looking only at players who played at least five games at centre in 2017 and only including regular-season matches – to look for the answer.
A tough job
While middle defenders are faced with the heaviest defensive workloads and the biggest bodies to tackle, a centre faces the toughest decisions. When to slide, when to jam in, how to position themselves to shut down the play without leaving their winger isolated, when to drop back to try and have a chance at defending an attacking kick without leaving too big a gap in the line – these are all decisions centres regularly have to make in a fraction of a second.
They also need to tackle big, wide-running back-rowers as often as fleet-footed wingers and fullbacks who exhibit blinding speed and footwork.
For this analysis, instead of focusing on the regular defensive bread-and-butter stat of tackles made versus tackles missed, we have chosen to look at "try causes". This refers to the number of times a centre had a chance to stop a try and didn't.
This could be due to a variety of reasons including defensive misreads or missed tackles that lead to tries, getting outjumped to an attacking kick, or getting caught out of position.
It's not always just the centre's fault
It is important to note not all try causes are equal. Sometimes a centre has dropped the ball cold on his own line allowing a free try to the opposition, or come rushing out of an otherwise set defensive line to leave a yawning gap for opponents to stroll through. Other times a centre earns a try cause for a play where there was a complete breakdown through the middle of the field and the poor old centre wasn't quite able to save his teammates' blushes. Either still goes down as a "1" in the try cause column.
It's also important to note centres who play in defensively sound teams like the Melbourne Storm, Cronulla Sharks, Brisbane Broncos and the Sydney Roosters are likely to face fewer tough decisions and broken play runners than the centres in teams with leaky middle defence and who consequently may end up higher on the try-cause list than they otherwise would have.
So who is the best?
With all that said, here are the best five centres by try causes per game in 2017.

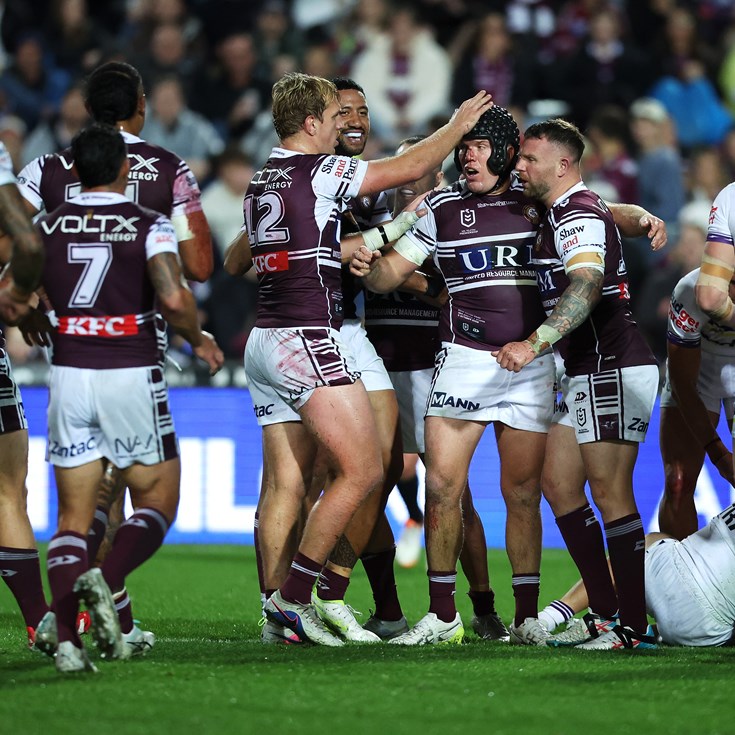
Given premiers Melbourne's near-impenetrable defence it is no surprise to see their two main centres at the top of this list. Chambers is a Kangaroos and Origin star and does a stellar job marshalling the Storm's right edge but the real story here is young Curtis Scott. The budding Blues back played 10 games at left centre despite a huge preference for his long-term junior position of right centre. While Cheyse Blair conceded 10 tries in 13 games (0.77 per game) before his injury, his young replacement was far better defending in the same system than his more experienced teammate.
"[Scott] was a right-side centre, but with Will here he had to become a left centre, and he did that really, really well," Storm football director Frank Ponissi told NRL.com.
"That might have been a little bit behind any frustrations he experienced [while pushing for a first-grade spot]; he had such a preference for right centre, he played all his junior footy there. But with Will here he had to change over and he's done it quite quickly.
"[His defensive record] doesn't surprise me at all; he works very hard at it."
Both Cowboys centres also recorded outstanding numbers with Linnett and Justin O'Neill (seven try causes in 17 games at 0.41 per game) in the NRL's top seven defensive centres. In a struggling Bulldogs team, noted defender Josh Morris (12 in 24 games at 0.50 per game and a league-high four try saves) was a standout.
And who needs work?
Unsurprisingly, centres who played for clubs that conceded a lot of tries and finished outside the top eight are concentrated near the top of this list.

Alarmingly for Wests Tigers coach Ivan Cleary, three of the top five are on his roster. With their increased depth in the outside backs in 2017, it may mean the end of back-rower Michael Chee-Kam's stint filling in out wide.
While the numbers also don't look favourable for Gold Coast's Dale Copley, on viewing those 25 try causes it's fair to say there were a significant number of those in which he was far from the only culprit. Copley's centre partner Konrad Hurrell had 14 try causes in 16 games at 0.88 per game and off-season recruit Brenko Lee was responsible for 13 try causes in 18 games at Canterbury last season.
"It is no surprise that we were a poor defensive team; part of that is the edge decisions that my edge and both edges of our team were making," Copley told NRL.com.
"Some was about stuff happening inside of us where we were caught short, and some was our own fault.
"But we were down the bottom as a defensive side for a reason. There is no one player [at fault]. It is a team effort. But with a new coach, a new defensive system, new players in key positions and having a full pre-season with the guys we are going to play with I am sure it can be turned around.
"Defence has been a focus in the pre-season because left, right, middle and the guys coming off the bench … we weren't good enough last year. I am sure you could find many stats to back that up."
Among the others who need to brush up a little are Joey Leilua (21 in 24 games at 0.88 per game at the Canberra Raiders) and Manly Sea Eagles rookie Brian Kelly (20 in 22 at 0.91) who were actually second and third after Copley in terms of most total try causes for the season.
Full table in order of fewest try causes per game to most try causes:
| Rank | Name | 2017 club | Matches at centre | Try causes | Average try causes |
| 1 | Will Chambers | Storm | 20 | 2 | 0.10 |
| 2 | Curtis Scott | Storm | 10 | 2 | 0.20 |
| 3 | Mitch Aubusson | Roosters | 10 | 2 | 0.20 |
| 4 | Kurt Mann | Dragons | 7 | 2 | 0.29 |
| 5 | Kane Linnett | Cowboys | 23 | 9 | 0.39 |
| 6 | Ryan Matterson | Roosters | 5 | 2 | 0.40 |
| 7 | Justin O'Neill | Cowboys | 17 | 7 | 0.41 |
| 8 | Brad Takairangi | Eels | 18 | 8 | 0.44 |
| 9 | Esan Marsters | Wests Tigers | 11 | 5 | 0.45 |
| 10 | Josh Morris | Bulldogs | 24 | 12 | 0.50 |
| 11 | Jack Bird | Sharks | 16 | 8 | 0.50 |
| 12 | Tim Lafai | Dragons | 24 | 13 | 0.54 |
| 13 | Michael Jennings | Eels | 21 | 12 | 0.57 |
| 14 | Ricky Leutele | Sharks | 24 | 14 | 0.58 |
| 15 | Waqa Blake | Panthers | 20 | 12 | 0.60 |
| 16 | Dylan Walker | Sea Eagles | 24 | 15 | 0.63 |
| 17 | Jarrod Croker | Raiders | 22 | 14 | 0.64 |
| 18 | Tautau Moga | Broncos | 24 | 16 | 0.67 |
| 19 | Kurt Capewell | Sharks | 9 | 6 | 0.67 |
| 20 | Chase Stanley | Bulldogs | 6 | 4 | 0.67 |
| 21 | Hymel Hunt | Rabbitohs | 10 | 7 | 0.70 |
| 22 | Brenko Lee | Bulldogs | 18 | 13 | 0.72 |
| 23 | Joseph Manu | Roosters | 15 | 11 | 0.73 |
| 24 | Peter Mata'utia | Knights | 23 | 17 | 0.74 |
| 25 | Kirisome Auva'a | Eels | 8 | 6 | 0.75 |
| 26 | Blake Ayshford | Warriors | 17 | 13 | 0.76 |
| 27 | Cheyse Blair | Storm | 13 | 10 | 0.77 |
| 28 | James Roberts | Broncos | 23 | 18 | 0.78 |
| 29 | Tyrone Peachey | Panthers | 15 | 12 | 0.80 |
| 30 | Roberts Jennings | Rabbitohs | 11 | 9 | 0.82 |
| 31 | David Fusitua | Warriors | 12 | 10 | 0.83 |
| 32 | Joey Leilua | Raiders | 24 | 21 | 0.88 |
| 33 | Konrad Hurrell | Titans | 16 | 14 | 0.88 |
| 34 | Bryson Goodwin | Rabbitohs | 8 | 7 | 0.88 |
| 35 | Javid Bowen | Cowboys | 8 | 7 | 0.88 |
| 36 | Solomone Kata | Warriors | 19 | 17 | 0.89 |
| 37 | Brian Kelly | Sea Eagles | 22 | 20 | 0.91 |
| 38 | Euan Aitken | Dragons | 12 | 11 | 0.92 |
| 39 | Dane Gagai | Knights | 16 | 15 | 0.94 |
| 40 | Latrell Mitchell | Roosters | 14 | 14 | 1.00 |
| 41 | Kevin Naiqama | Wests Tigers | 13 | 13 | 1.00 |
| 42 | Dean Whare | Panthers | 10 | 10 | 1.00 |
| 43 | Tyrell Fuimaono | Rabbitohs | 7 | 7 | 1.00 |
| 44 | Siosifa Talakai | Rabbitohs | 7 | 7 | 1.00 |
| 45 | Joe Wardle | Knights | 6 | 6 | 1.00 |
| 46 | Aaron Gray | Rabbitohs | 5 | 5 | 1.00 |
| 47 | Young Tonumaipea | Storm | 5 | 5 | 1.00 |
| 48 | Jarryd Hayne | Titans | 5 | 5 | 1.00 |
| 49 | Michael Chee-Kam | Wests Tigers | 9 | 11 | 1.22 |
| 50 | Moses Suli | Wests Tigers | 9 | 12 | 1.33 |
| 51 | Dale Copley | Titans | 16 | 25 | 1.56 |