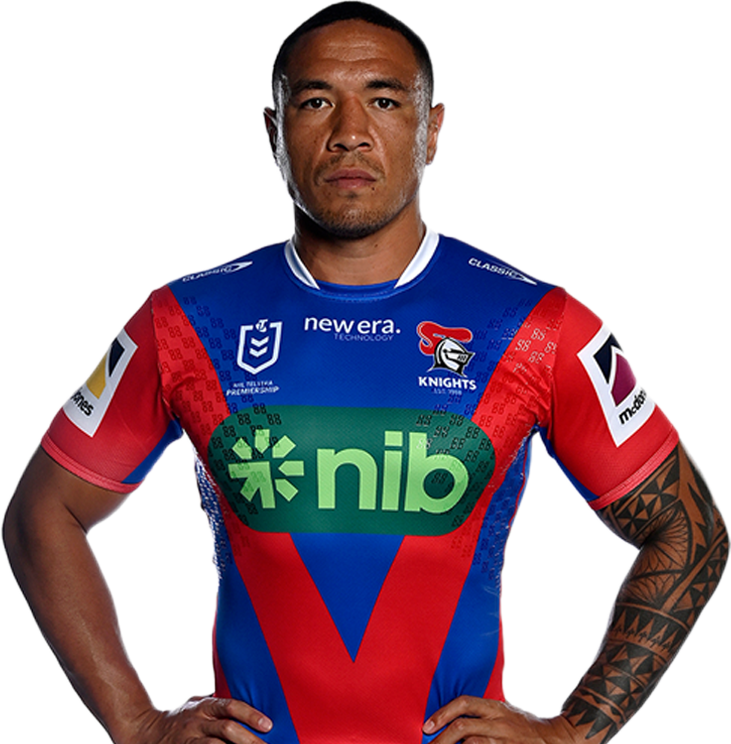

Tyson Frizell
2nd Row
Player Bio
- Height:
- 183 cm
- Date of Birth:
- 09 October 1991
- Weight:
- 108 kg
- Birthplace:
- Wollongong, NSW
- Age:
- 32
- Nickname:
- Friz
- Debut Club:
- Cronulla-Sutherland Sharks
- Date:
- 29 July 2011
- Opposition:
- Brisbane Broncos
- Round:
- 21
- Previous Clubs:
- Cronulla-Sutherland Sharks, St. George Illawarra Dragons
- Junior Club:
- Corrimal Cougars
- Biography:
Knight #321
A dynamic and hard-running back-rower, Tyson Frizell has established himself as one of the games best edge forwards in a career spanning the last 14 years.
Frizell started his career at the Cronulla Sharks before becoming an established first-grader at the St George Illawarra Dragons.
A NSW and Australian representative, Frizell made the move up the M1 in 2021 to join the Knights earning the Danny Buderus Medal for the Club's Player of the Year in 2022.
In 2023, Frizell had another big year earning re-selection for NSW and awarded the Club's Player's Player award.
Career
- Appearances
- 243
- Tries
- 37
2024 Season
- Appearances
- 4
Scoring
- Tries
- 2
Attack
- Line Breaks
- 1
- Line Break Assists
- 0
Passing
- Offloads
- 4
Defence
- Tackles Made
- 123
- Tackle Efficiency
-
Running Metres
- Average Running Metres
- 95
- Total Running Metres
- 383
Fantasy
- Total Points
- 190
- Average Points
- 47.5
2024 Season - By Round
| Round | Opponent | Score | Position | Minutes Played | Tries | Goals | 1 Point Field Goals | 2 Point Field Goals | Points | Try Assists | Linebreaks | Tackle Breaks | Post Contact Metres | Offloads | Receipts | Tackles Made | Missed Tackles | Total Running Metres | Hit Up Running Metres | Kick Return Metres | |
|---|---|---|---|---|---|---|---|---|---|---|---|---|---|---|---|---|---|---|---|---|---|
| 1 | Raiders | Lost | 12 - 28 | 2nd Row | 80 | 1 | - | - | - | 4 | - | 1 | 4 | 20 | - | 13 | 33 | - | 76 | 76 | - |
| 2 | Cowboys | Lost | 21 - 20 | 2nd Row | 73 | - | - | - | - | - | - | - | 1 | 57 | 1 | 16 | 21 | 2 | 122 | 115 | - |
| 3 | Storm | Won | 14 - 12 | 2nd Row | 62 | - | - | - | - | - | - | - | 2 | 29 | 2 | 12 | 27 | 2 | 91 | 79 | - |
| 4 | Warriors | Lost | 20 - 12 | 2nd Row | 80 | 1 | - | - | - | 4 | - | - | 3 | 38 | 1 | 16 | 42 | 4 | 94 | 84 | - |
Career By Season
| Year | Played | Won | Lost | Drawn | Win % | Tries | Goals | 1 Point Field Goals | 2 Point Field Goals | Points | Kicking Metres | Kicking Metres Average | Linebreaks | Offloads | Tackles Made | Missed Tackles | Tackle Efficiency | Total Running Metres | Average Running Metres | Kick Return Metres | Total Points | Average Points | |
|---|---|---|---|---|---|---|---|---|---|---|---|---|---|---|---|---|---|---|---|---|---|---|---|
| Sharks | 2011 | 2 | - | 2 | - | - | - | - | - | - | - | - | - | - | - | 28 | - | 92.85% | 47 | 23.00 | - | - | - |
| Sharks | 2012 | 10 | 4 | 5 | 1 | 40% | 2 | - | - | - | 8 | - | - | 2 | 3 | 210 | 12 | 94.59% | 818 | 81.00 | 10 | - | - |
| Dragons | 2013 | 22 | 6 | 16 | - | 27% | 2 | - | - | - | 8 | 24 | 1.09 | 2 | 17 | 560 | 38 | 89.94% | 1,832 | 83.00 | - | 765 | 34.8 |
| Dragons | 2014 | 16 | 8 | 8 | - | 50% | 4 | - | - | - | 16 | 10 | 0.64 | 2 | 8 | 340 | 17 | 91.38% | 1,438 | 89.00 | 121 | 479 | 29.9 |
| Dragons | 2015 | 21 | 10 | 11 | - | 48% | 4 | - | - | - | 16 | - | - | 5 | 9 | 753 | 36 | 95.44% | 2,238 | 106.00 | 12 | 1,117 | 53.2 |
| Dragons | 2016 | 21 | 8 | 13 | - | 38% | 3 | - | - | - | 12 | 6 | 0.29 | 1 | 9 | 691 | 26 | 93.43% | 2,008 | 95.00 | 20 | 952 | 45.3 |
| Dragons | 2017 | 22 | 12 | 10 | - | 55% | 1 | - | - | - | 4 | 19 | 0.85 | 4 | 20 | 617 | 37 | 94.34% | 2,382 | 108.00 | 83 | 977 | 44.4 |
| Dragons | 2018 | 23 | 14 | 9 | - | 61% | 5 | - | - | - | 20 | 10 | 0.45 | 4 | 21 | 725 | 37 | 95.14% | 2,543 | 110.00 | 10 | 1,107 | 48.1 |
| Dragons | 2019 | 21 | 7 | 14 | - | 33% | 2 | - | - | - | 8 | - | - | - | 17 | 617 | 37 | 94.34% | 1,972 | 93.00 | 21 | 812 | 38.7 |
| Dragons | 2020 | 20 | 7 | 13 | - | 35% | 3 | - | - | - | 12 | - | - | 3 | 19 | 735 | 29 | 96.20% | 2,522 | 126.00 | 1 | 1,113 | 55.6 |
| Knights | 2021 | 19 | 9 | 10 | - | 47% | 3 | - | - | - | 12 | - | - | 5 | 23 | 673 | 38 | 94.66% | 2,258 | 118.00 | 13 | 1,062 | 55.9 |
| Knights | 2022 | 21 | 5 | 16 | - | 24% | 3 | - | - | - | 12 | 40 | 1.90 | 2 | 17 | 654 | 51 | 92.77% | 2,279 | 108.00 | 69 | 990 | 47.1 |
| Knights | 2023 | 22 | 13 | 8 | 1 | 59% | 4 | - | - | - | 16 | - | - | 6 | 17 | 690 | 29 | 95.97% | 2,434 | 110.00 | - | 1,134 | 51.6 |
| Knights | 2024 | 4 | 1 | 3 | - | 25% | 2 | - | - | - | 8 | - | - | 1 | 4 | 123 | 8 | 93.89% | 383 | 95.00 | - | 190 | 47.5 |
Career Overall
| Year Start | Year End | Played | Won | Lost | Drawn | Win % | Tries | Goals | 1 Point Field Goals | 2 Point Field Goals | Points | Kicking Metres | Kicking Metres Average | Linebreaks | Offloads | Tackles Made | Missed Tackles | Tackle Efficiency | Total Running Metres | Average Running Metres | Kick Return Metres | Total Points | Average Points | |
|---|---|---|---|---|---|---|---|---|---|---|---|---|---|---|---|---|---|---|---|---|---|---|---|---|
| Sharks | 2011 | 2012 | 12 | 4 | 7 | 1 | 33% | 2 | - | - | - | 8 | - | - | 2 | 3 | 238 | 12 | 95.20% | 865 | 72.00 | 10 | - | - |
| Dragons | 2013 | 2020 | 165 | 71 | 94 | - | 43% | 23 | - | - | - | 92 | 59 | 0.36 | 21 | 120 | 4,647 | 256 | 94.78% | 15,649 | 94.00 | 269 | 6,798 | 41.2 |
| Knights | 2021 | 2024 | 66 | 28 | 37 | 1 | 42% | 12 | - | - | - | 48 | 40 | 0.61 | 14 | 61 | 2,140 | 126 | 94.44% | 7,355 | 111.00 | 83 | 3,376 | 51.2 |
Latest
Team Mates

National Rugby League respects and honours the Traditional Custodians of the land and pay our respects to their Elders past, present and future. We acknowledge the stories, traditions and living cultures of Aboriginal and Torres Strait Islander peoples on the lands we meet, gather and play on.


